Hi again.
Since I most familiar with the Uppsala Conflict Data Program’s (UCDP) data on conflict related fatalities, I thought it’d be a good idea to upload my first map using their geo-referenced event data set UCDP Georeferenced Event Dataset (GED) Global version 18.1 (2017).
The UCDP defines an “event event as: ‘An incident wherearmed forcewasby an organised actoragainst another organized actor, or against civilians, resulting in at least 1 direct deathat a specific locationand aspecific date’.” (Croicu, Mihai and Ralph Sundberg,2017, “UCDP GED Codebook version 17.1”, Department of Peace and Conflict Research, Uppsala University ).
What is on the map?
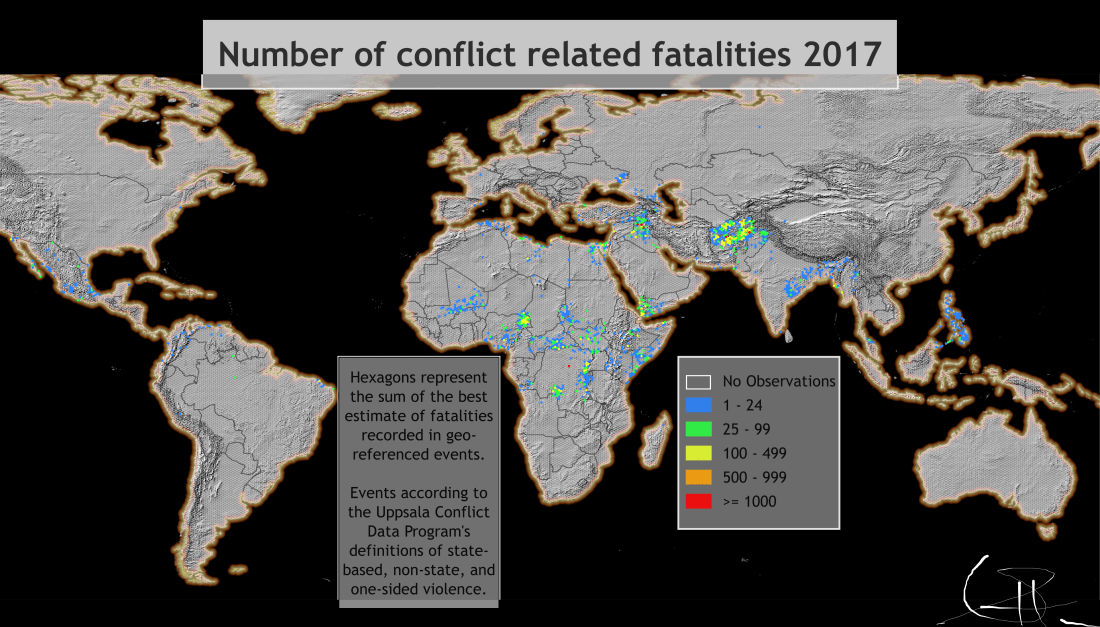
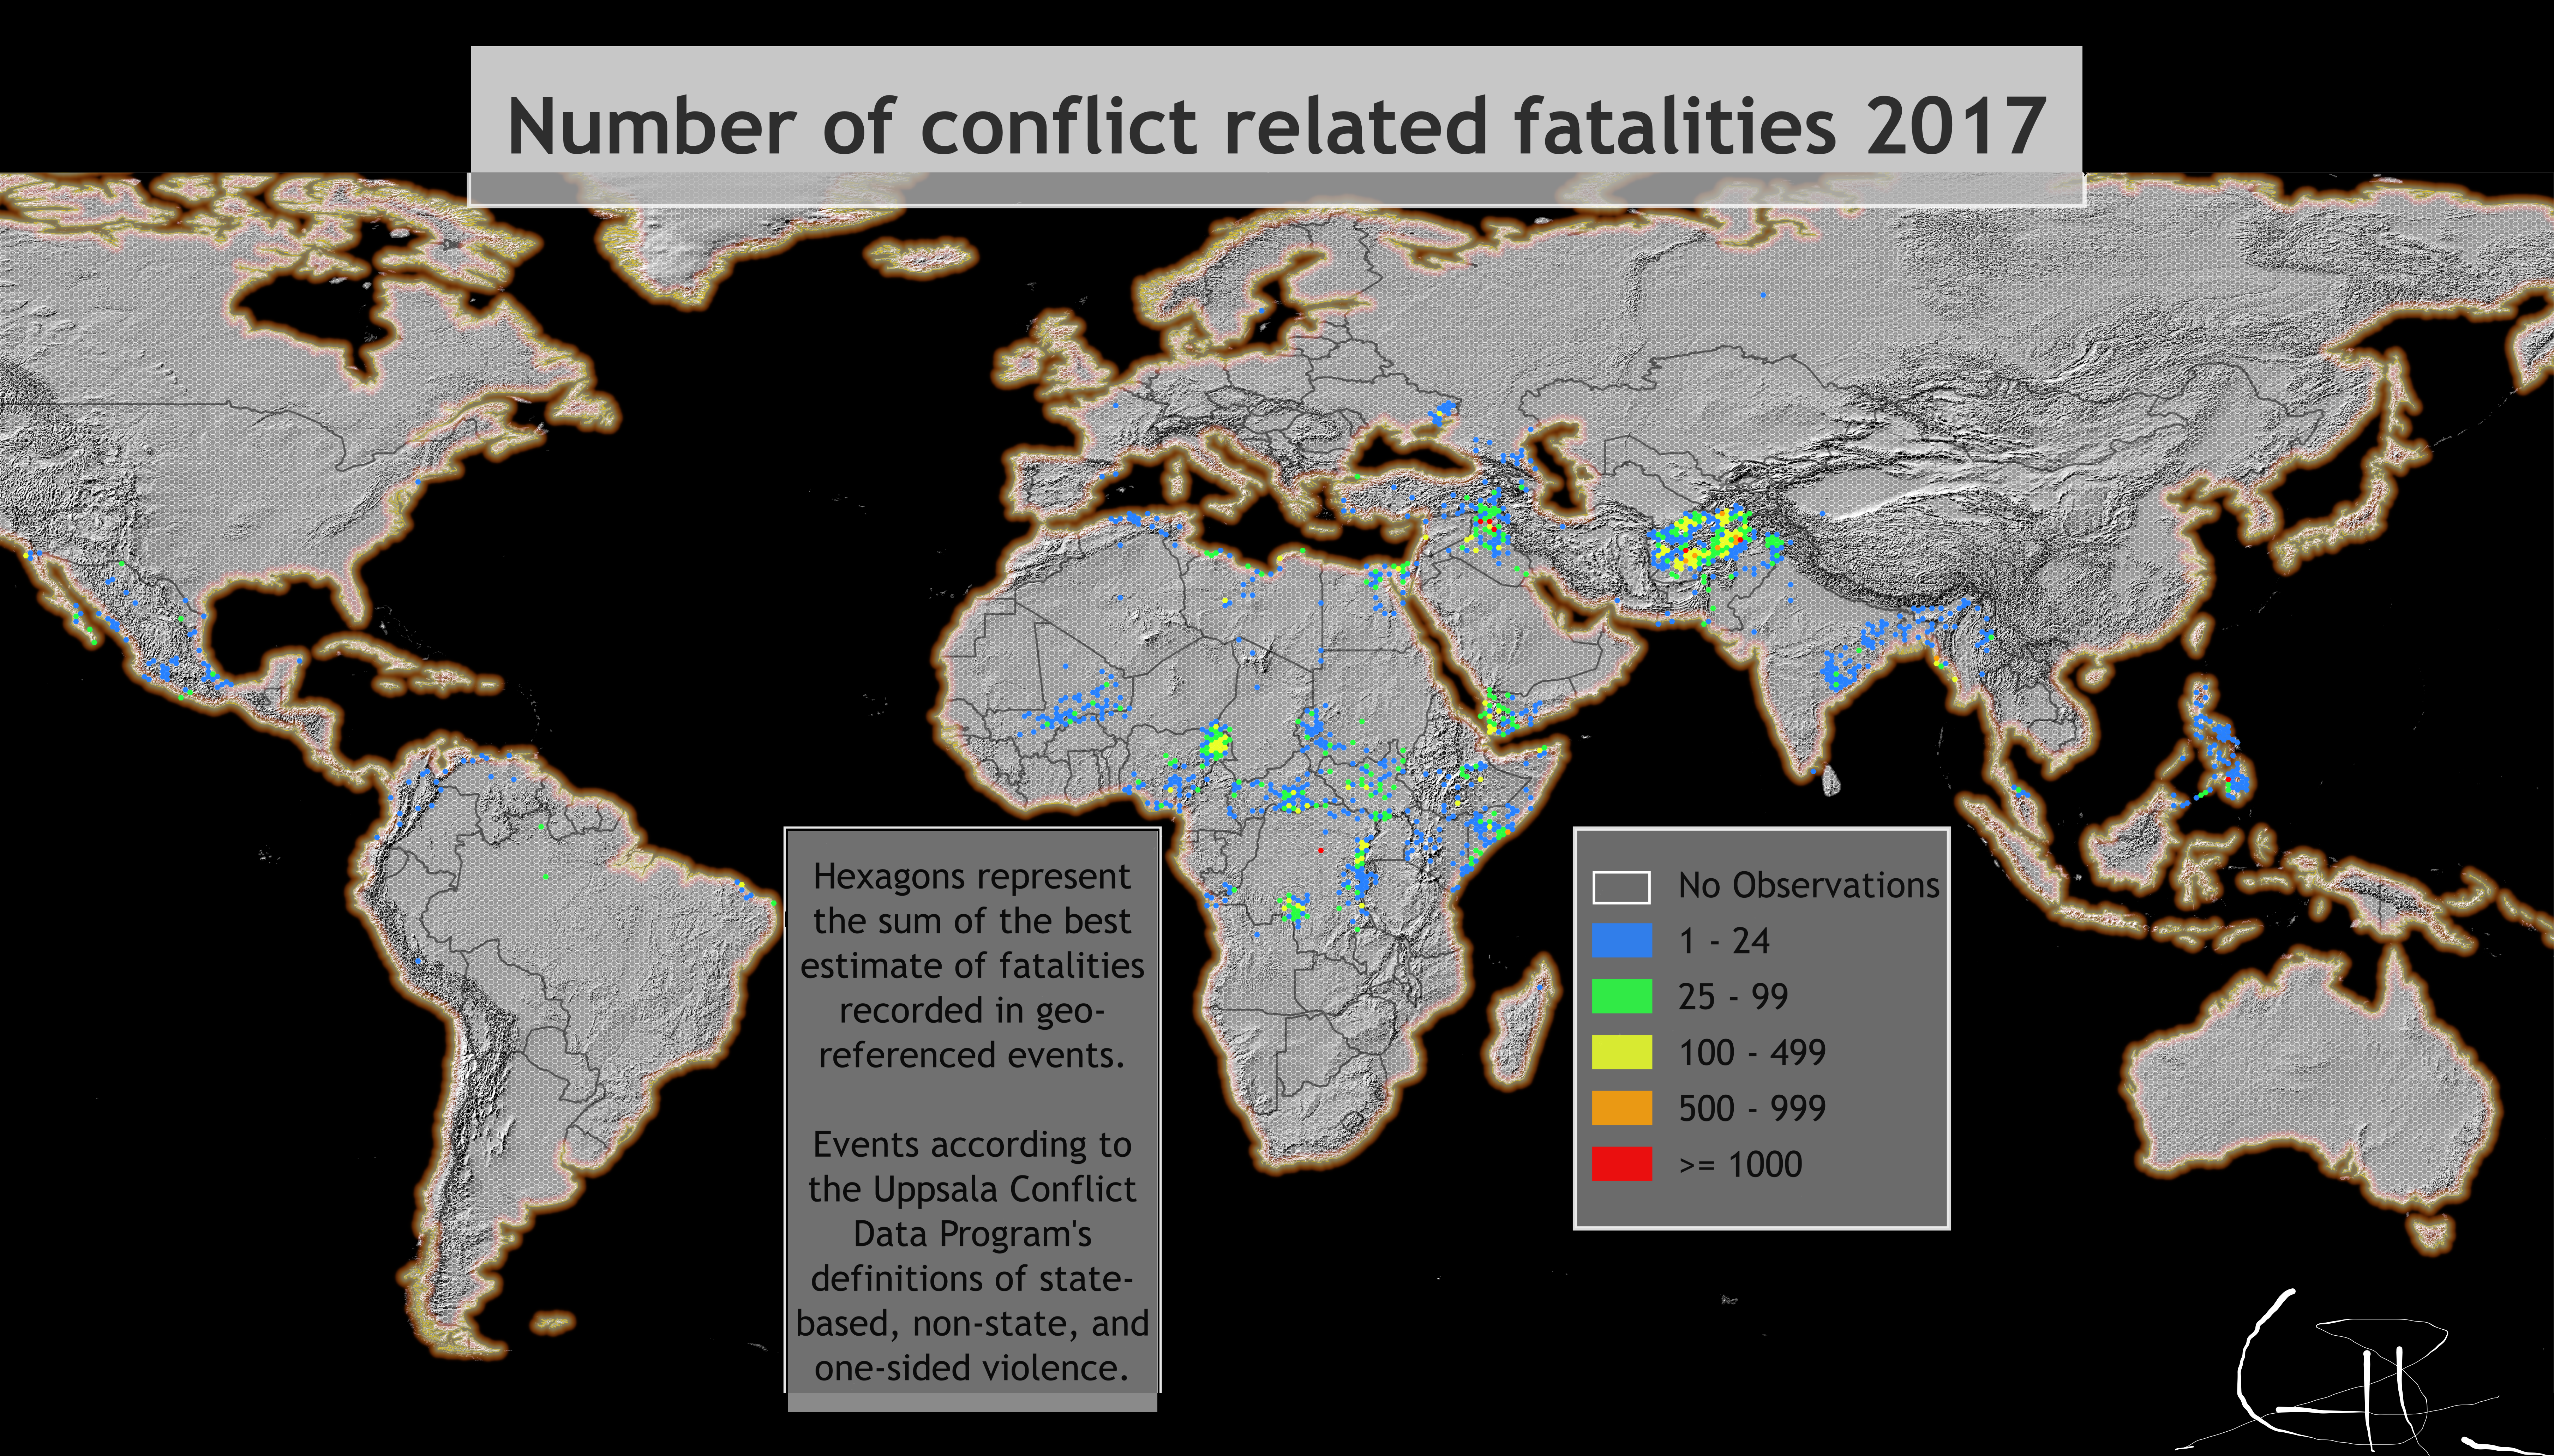
I created a hexagon grid layer as arbitrary (also arbitrarily sized) spatial units. As it is possible that multiple individual events land within a hexagon, I let QGIS calculate the sum of the “best estimate” for all events per hexagon. The best estimate is, as the variable name states, the best estimate the UCDP has for all information contained in the event, specifically the number of people reported to have been killed. Then, I semi-arbitrarily defined increments of fatalities. Semi-arbitrary, as 25 deaths is the inclusion threshold for the data set (for a dyad, not an event, see below), and 1000, as anything beyong 1000 fatalities per calender year is considered war(-like). “War-like” as for the UCDP, a war must involve a state (their state-based violence definition), yet other categories can go beyond that threshold, too. The colours are also chosen at random and to my liking. As it is a world map and the spatial units relatively small, I suggest zooming in to be able to see something.
The Data
The data in the GED contains information, among other things, regarding three different types of violence, according to the UCDP’s defintion of types of violence: state-based, non-state and one-sided violence. The UCDP collects data using predominantely news media, local radios, international and local NGOs as well as expert reports. The events are coded to the exact location if possible, otherwise coded to the centroid of the administration units of the countries, the country as a whole, or an event is attributed to representation points. The precision scores indicate how precise the location is. In addition, the data contains information on the actors involved. I also want to flag that data for Syria is unfortunately not available at this point.
I won’t go into detail of the different categories of violence (see https://www.pcr.uu.se/research/ucdp/definitions/). Broadly speaking, state-based violence involves a state and a formally organized actor, non-state violence involves two actors of the same level of organization. One-sided violence is committed by a formally organized group, such as the state or a rebel group and involves the intentional killing of unarmed civilians. To be included in the dataset a dyad (e.g. Government-Rebel group, Rebel-Rebel, Government-Civilians), a dyad has to reach 25 deaths in a calender year.
I used QGIS to make the map. The layers are a Shaded Relief layer from Natural Earth (https://www.naturalearthdata.com/) and the admin units (country/province) are from GADM (gadm.org). The coastline and ocean are also from Natural Earth.
One more point: the countries with the most recorded deaths were Syria (not on map), Afghanistan, Iraq, DRC, Nigeria, Yemen